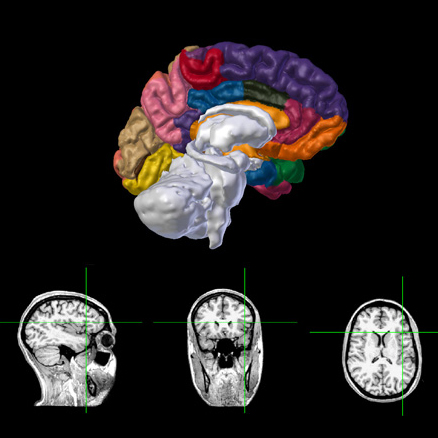
Anatomy
3D surface base visualization of the hemispheres and subcortical regions with MRI/CT slices viewer.
MEG
Interactive visualization of sensors and source space EEG data.
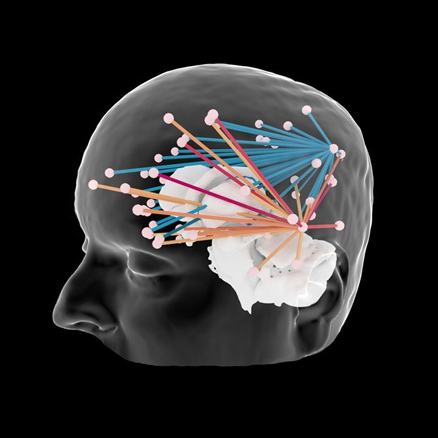
Connectivity
Interactive connectivity between MEG/EEG sensors, cortical labels and invasive electrodes.
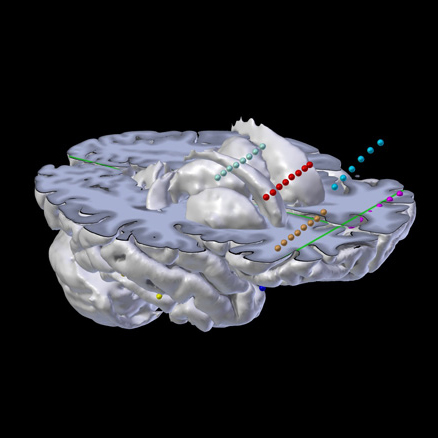
Depth Electrodes
Interactive visualization of Depth Electrodes, ECOG, depth, DBS, etc.
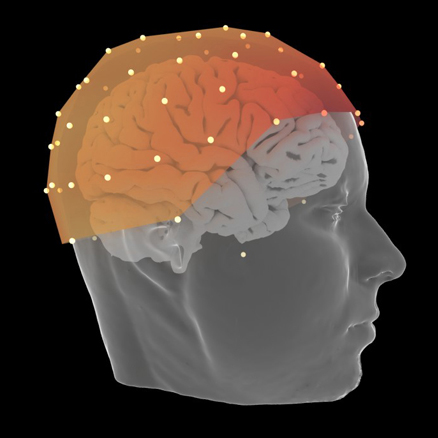
EEG
Interactive visualization of sensors and source space EEG data.
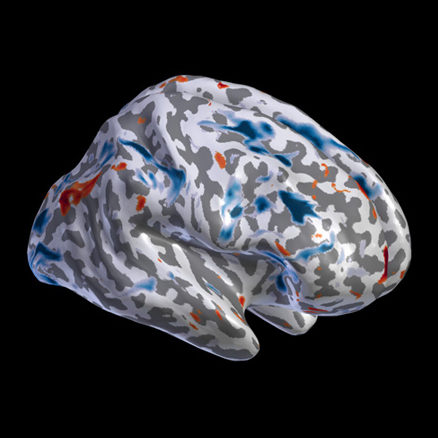
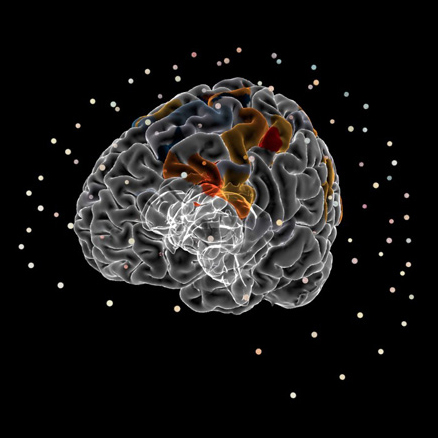
fMRI
Contrast maps and resting state 4D fMRI/PET data projected on the cortical and subcortical surfaces.
Anatomy
3D surface base visualization of the hemispheres and subcortical regions with MRI/CT slices viewer.
MEG
Interactive visualization of sensors and source space EEG data.
Connectivity
Interactive connectivity between MEG/EEG sensors, cortical labels and invasive electrodes.
Depth Electrodes
Interactive visualization of Depth Electrodes, ECOG, depth, DBS, etc.
EEG
Interactive visualization of sensors and source space EEG data.
fMRI
Contrast maps and resting state 4D fMRI/PET data projected on the cortical and subcortical surfaces.